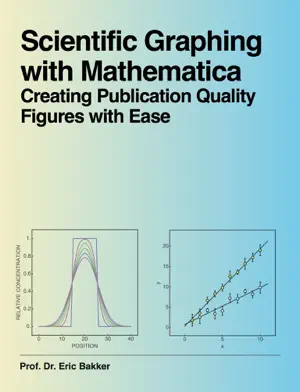
Scientific Graphing with Mathematica
R$ 17,90
Comprar na Amazon Ver no Apple BooksPrefere em papel? Todos os formatos na Amazon →
Preço no Apple Books. Na Amazon pode ser diferente.
- Publicado
- Gêneros
- QuímicaCiência e natureza
Nas listas
| Posição | Melhor | Dias | |
|---|---|---|---|
| Química | #67 | #67 | 5 |
Para autores: coloque este selo no seu site

Copie este código no seu site ou blog:
Descrição
This little handbook is aimed at scientists that have access to Mathematica software and who would like to output publication quality scientific graphs. It is written with the analytical chemist in mind but can be used by people working in many other disciplines. The handbook will help you with the following questions:
How do I get my data from Excel to Mathematica?
How do I manipulate the data once it is in Mathematica?
How can I make great looking 2D plots that I can publish?
I don’t like Mathematica’s choice of plot symbols, are there better ways?
How can I plot error bars from a set of replicate data?
Eric Bakker is professor of analytical chemistry at the University of Geneva in Switzerland. He has prepared this book specifically to help his group members handle this program with greater ease.
How do I get my data from Excel to Mathematica?
How do I manipulate the data once it is in Mathematica?
How can I make great looking 2D plots that I can publish?
I don’t like Mathematica’s choice of plot symbols, are there better ways?
How can I plot error bars from a set of replicate data?
Eric Bakker is professor of analytical chemistry at the University of Geneva in Switzerland. He has prepared this book specifically to help his group members handle this program with greater ease.


